Hindustan Unilever Limited Research Report
|
Industry |
Market Price |
Recommendation |
Target |
Time Horizon |
|
FMCG |
2,152.15 |
Buy |
2,561 |
10 months |
Q3 FY 2022 Review
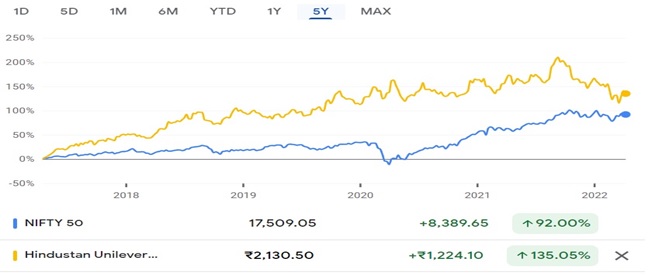
Hindustan Unilever Limited reported net revenue of ₹13,439 crores for the quarter ended December 31, 2021, compared to ₹12,181 crores for December 31, 2020. EBIT and Profit After Tax were ₹3,143 crores and ₹2300 crores for the quarter ended, 31, 2021, as compared to ₹2,643 crores and ₹ 1,938 crores, during the corresponding quarter of the previous year.
Hindustan Unilever Limited - Investment Summary
|
CMP (₹) |
2,152.15 |
|
52 Week H/L |
1,901/2,859 |
|
Market Cap (crores) |
5,05,667 |
|
Face Value (₹) |
1.00 |
|
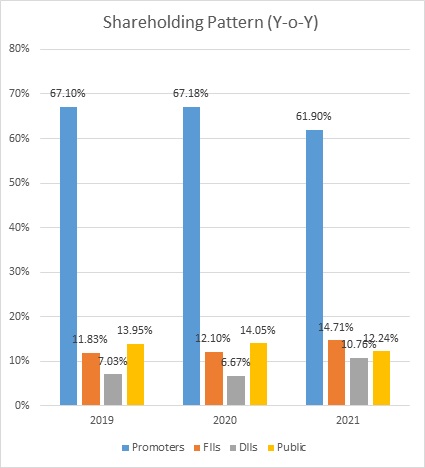
Promoter Holding (%) |
61.90 |
|
Non-Promoter Holding (%) |
30.90 |
|
Total (%) |
100.00 |
|
Book Value |
₹202.95 |
|
EPS TTM |
₹34.03 |
Overview
-
HUL is India's largest fast-moving consumer goods company with strong brands across categories and prices.
-
The brands have high visibility and have sustained their market leadership in more than 80% of their business, backed by an extensive distribution network and strong advertising and marketing support.
-
The company received approval for the PLI scheme for Ready to Cook/ Ready to Eat and Processed Fruits & Vegetables.
-
The company has been assigned AAA/stable credit rating on a long-term bank facility.
Beta: 0.61 |
Alpha: 3.4 |
Risk Reward Ratio: 1.32 |
Margin of Safety: 15% |
Hindustan Unilever Limited - Quarterly Summary
|
Quarterly (INR in crores) |
Dec-21 |
Sep-21 |
Jun-21 |
Mar-21 |
Dec-20 |
|
Revenue from Operations |
13,439 |
13,046 |
12,194 |
12,433 |
12,181 |
|
Other income |
60 |
53 |
66 |
109 |
54 |
|
Total Income |
13,499 |
13,099 |
12,260 |
12,542 |
12,235 |
|
|
|||||
|
Total Expenditure |
10302 |
10101 |
9533 |
9656 |
9504 |
|
EBIT |
3,197 |
2,998 |
2,727 |
2,886 |
2,731 |
|
|
|||||
|
Finance cost |
27 |
28 |
13 |
11 |
44 |
|
EBT before Exceptional Items |
3,170 |
2,970 |
2,714 |
2,875 |
2,687 |
|
|
|||||
|
Exceptional items |
(67) |
(5) |
(27) |
14 |
(51) |
|
PBT |
3,103 |
2,965 |
2,687 |
2,889 |
2,636 |
|
|
|||||
|
Tax Expenses |
803 |
698 |
587 |
698 |
783 |
|
PAT |
2,300 |
2,267 |
2,100 |
2,191 |
1,853 |
Business
-
HUL is India’s largest FMCG company and has a diverse product portfolio, including soaps & detergents, personal care products, and beverages. The company has owned factories and many outsourced production facilities across the country.
-
The company has 14 brands with ₹1,000 crores in annual sales.
-
In 2015, the company acquired the ‘Indulekha’ brand from Mosons Group for a consideration of 330 cores along.
-
In 2020, the company acquired the brand ‘Vwash’ from Glenmark Pharmaceuticals Limited. The brand was launched in 2013 and has established itself as a market leader in the female intimate hygiene category.
-
The amalgamation of GlaxoSmithKline Consumer Limited will enhance the market position of HUL in the foods and refreshment segment and will increase the revenue diversity in the medium term.
-
HUL business segments include:
-
Beauty & Personal Care Segments:
-
Brands under this segment include:
-
Skin Cleansing - Dove, Lifebuoy, LUX, Pears, Liril.
-
Oral Care - Pepsodent, Closeup, Lever Auyush.
-
Hair Care - Tresemme, Dove, Indulekha.
-
Skincare - Glow & Lovely, Pond’s, Vaseline.
-
-
-
Home Care Segment:
-
Brands under this segment include:
-
Household Care - Vim, Domex, Sunlight.
-
Fabric Wash - Comfort, Wheel, Rin, Surf excel.
-
Purifiers - Puriet.
-
-
-
Foods & Refreshments Segment:
-
Brand under this segment includes:
-
Foods - Knorr, Kissan, Hellmann’s, Annapurna.
-
Beverages - Lipton, Bru, Broke Bond Red Label, Taj Mahal, Taaza.
-
Nutrition - Horlicks, Boost.
-
Ice Cream - Kwality Walls.
-
-
-
-
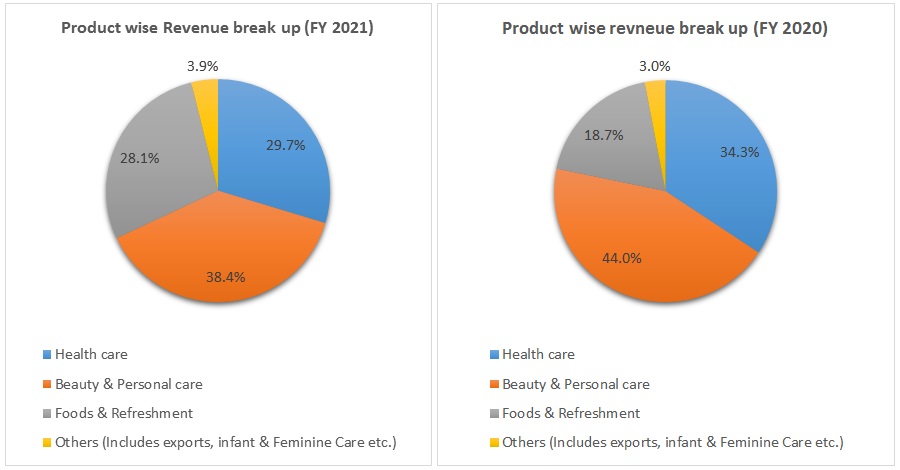
Out of the total revenue, 29.7% of revenue have generated from Health Care, 38,4% from Beauty & Personal Care, 28,1% from Food & Refreshment, and 3.9% from others % in FY 2021, compared to 34.3%, 44%, 18,7% and 3% in FY 2020 respectively.
-
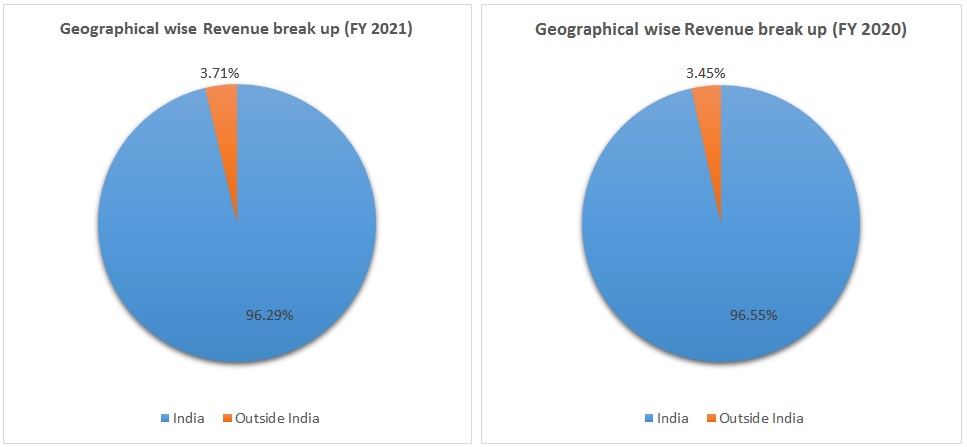
Out of the total revenue, 96.29% of income has been generated from India, and 3.71% from outside India in FY 2021, compared to 96.55% and 3.45% in FY 2020 respectively.
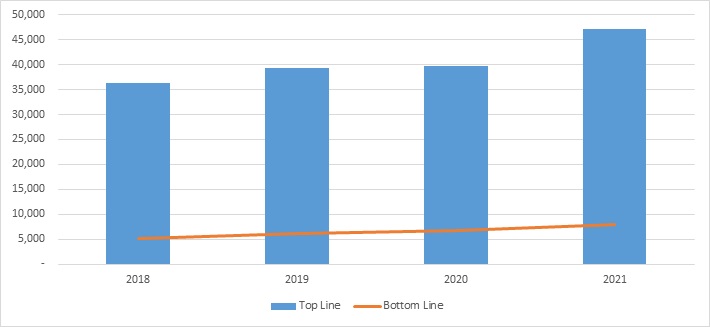
Hindustan Unilever Limited - Revenue Trend
Topline and Bottomline trend (crores)
Ratio Analysis
|
|
Mar-18 |
Mar-19 |
Mar-20 |
Mar-21 |
|
Profitability Ratio |
|
|
|
|
|
Gross Profit |
54.89% |
54.40% |
55.69% |
53.78% |
|
EBITDA Margin |
21.75% |
23.99% |
26.38% |
25.59% |
|
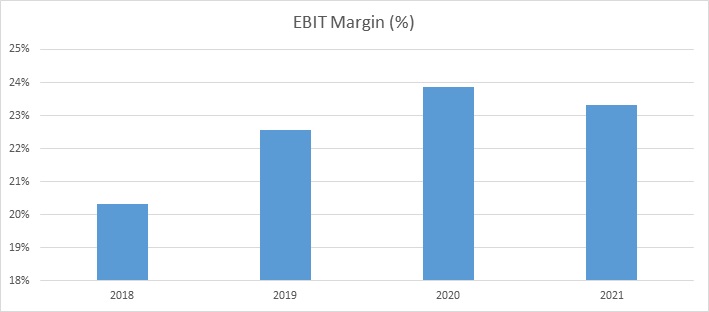
EBIT Margin |
20.32% |
22.55% |
23.86% |
23.31% |
|
Pre-Tax Margin |
20.25% |
22.47% |
23.56% |
23.06% |
|
Net Profit Margin |
14.42% |
15.42% |
16.98% |
17.01% |
|
|
|
|
|
|
|
Return on Investment |
|
|
|
|
|
Return on Asset – ROA |
31.14% |
33.21% |
34.84% |
17.99% |
|
Return on Capital Employed – ROCE |
86.79% |
93.63% |
91.27% |
32.01% |
|
Return on Equity – ROE |
74.32% |
79.81% |
83.76% |
28.60% |
|
|
|
|
|
|
|
Liquidity Ratio |
|
|
|
|
|
Current ratio (x) |
1.31 |
1.37 |
1.32 |
1.28 |
|
Quick Ratio |
1.029 |
1.078 |
1.025 |
0.958 |
|
|
|
|
|
|
|
Turnover Ratio |
|
|
|
|
|
Receivables Turnover |
12.06158 |
50.54 |
69.04 |
70.86 |
|
Inventory Turnover |
55.13 |
167.19 |
162.46 |
175.3 |
|
Payables Turnover |
145.69 |
63.87 |
160.86 |
151.37 |
|
Asset Turnover |
2.16 |
2.15 |
2.05 |
1.06 |
|
|
|
|
|
|
|
Solvency Ratio |
|
|
|
|
|
Debt to Equity |
0 |
0 |
0 |
0 |
|
Interest Coverage Ratio |
283.20 |
268.60 |
80.43 |
93.69 |
Hindustan Unilever Limited - Financial Overview
Profit and Loss Statement (₹ in crores)
|
|
Mar-18 |
Mar-19 |
Mar-20 |
Mar-21 |
|
Revenue |
36,238 |
39,310 |
39,783 |
47,028 |
|
Other income |
384.00 |
550.00 |
632.00 |
410.00 |
|
Total Revenue |
36,622 |
39,860 |
40,415 |
47,438 |
|
|
||||
|
Cost of Goods Sold |
16,730 |
18,474 |
18,259 |
22,148 |
|
Gross Profit |
19,892 |
21,386 |
22,156 |
25,290 |
|
|
||||
|
Excise Duty |
693.00 |
- |
- |
- |
|
Employee benefit expense |
1,860 |
1,875 |
1,820 |
2,358 |
|
Other Expenses |
9,456 |
10,081 |
9,843 |
10,896 |
|
EBITDA |
7,883 |
9,430 |
10,493 |
12,036 |
|
|
||||
|
Depreciation and amortisation expenses |
520 |
565 |
1,002 |
1,074 |
|
EBIT |
7,363 |
8,865 |
9,491 |
10,962 |
|
|
||||
|
Finance costs |
26 |
33 |
118 |
117 |
|
EBT Before exceptional item |
7,337 |
8,832 |
9,373 |
10,845 |
|
|
||||
|
Exceptional items |
(33.00) |
(228.00) |
(200.00) |
(239.00) |
|
Profit before tax |
7,304 |
8,604 |
9,173 |
10,606 |
|
|
||||
|
Income Tax Expense |
2,079 |
2,544 |
2,409 |
2,606 |
|
Profit from continuing operations (A) |
5,225 |
6,060 |
6,764 |
8,000 |
|
Discontinued operations: |
||||
|
Profit/Loss of the year from discontinued operations |
2 |
0 |
(6) |
(1) |
|
Tax credit of discontinued operations |
- |
- |
(2.00) |
- |
|
Loss of the year from discontinued operations after tax (B) |
2 |
0 |
(8) |
(1) |
|
|
||||
|
(Loss)/Profit of the year (C)= (A)+(B) |
5,227 |
6,060 |
6,756 |
7,999 |
|
|
||||
|
EPS |
||||
|
Basic |
24.08 |
27.97 |
31.21 |
34.03 |
|
Diluted |
24.07 |
27.96 |
31.21 |
34.03 |
|
|
||||
|
Number of shares |
||||
|
Basic |
216.42 |
216.53 |
216.46 |
216.22 |
|
Diluted |
216.46 |
216.58 |
216.50 |
216.24 |
Cash Flow Statement (₹ in crores)
|
|
Mar-18 |
Mar-19 |
Mar-20 |
Mar-21 |
|
Net Profit Before Tax |
7304 |
8604 |
9173 |
10606 |
|
Net Cash from Operating Activities |
6059 |
5800 |
7623 |
9163 |
|
Net Cash Used for Investing Activities |
-1063 |
-438 |
1791 |
-1528 |
|
Net Cash From (Used For) Financing Activities |
-4975 |
-5390 |
-6819 |
-9309 |
|
Net Increase in Cash and Cash Equivalents |
21 |
-28 |
2595 |
-1674 |
|
Cash And Cash Equivalents at The Beginning of The Year |
628 |
649 |
621 |
3216 |
|
Cash And Cash Equivalents at The End of Year |
649 |
621 |
3216 |
1842 |
Balance Sheet (₹ in crores)
|
|
Mar-18 |
Mar-19 |
Mar-20 |
Mar-21 |
|
Assets |
|
|
|
|
|
Non-Current Assets |
|
|
|
|
|
Property, Plant & Equipment |
4,080 |
4,192 |
4,960 |
6,116 |
|
Capital WIP |
461 |
406 |
597 |
745 |
|
Goodwill |
- |
36 |
36 |
17,316 |
|
Other Intangible Assets |
367 |
406 |
402 |
27,930 |
|
Goodwill On Consolidation |
81 |
81 |
81 |
81 |
|
Investment In Subsidiaries, Association and Joint Venture |
0 |
0 |
0 |
0 |
|
Financial Assets: |
||||
|
Investments |
2 |
2 |
2 |
2 |
|
Loans |
184 |
215 |
238 |
251 |
|
Other Financial Assets |
6 |
11 |
3 |
617 |
|
Non-Current Assets (Net) |
635 |
835 |
1,083 |
1,246 |
|
Deferred Tax Assets (Net) |
302 |
373 |
284 |
17 |
|
Other Non-Current Assets |
84 |
158 |
146 |
219 |
|
Total Non-Current Assets |
6,202 |
6,715 |
7,832 |
54,540 |
|
|
||||
|
Current Assets |
||||
|
Inventories |
2,513 |
2,574 |
2,767 |
3,579 |
|
Financial Assets |
||||
|
Investments |
2,871 |
2,714 |
1,253 |
2,707 |
|
Loans |
4 |
4 |
- |
- |
|
Trade Receivables |
1,310 |
1,816 |
1,149 |
1,758 |
|
Cash And Cash Equivalents |
649 |
621 |
3,216 |
1,842 |
|
Bank Balances Other Than Cash and Cash Equivalents |
2,836 |
3,136 |
1,897 |
2,629 |
|
Other Financial Assets |
805 |
605 |
1,420 |
1,188 |
|
Other Current Assets |
656 |
440 |
601 |
497 |
|
Assets Held for Sale |
16 |
4 |
18 |
17 |
|
Total Current Assets |
11,660 |
11,914 |
12,321 |
14,217 |
|
|
||||
|
Total Assets |
17,862 |
18,629 |
20,153 |
68,757 |
|
|
||||
|
Equities & Liabilities |
||||
|
Equity |
||||
|
Equity Share Capital |
216 |
216 |
216 |
235 |
|
Other Equity |
7,065 |
7,651 |
8,013 |
47,439 |
|
Equity Attributable to Owners of The Company |
7,281 |
7,867 |
8,229 |
47,674 |
|
|
||||
|
Non-Controlling Interests |
20 |
18 |
17 |
20 |
|
Total Equity |
7,301 |
7,885 |
8,246 |
47,694 |
|
|
||||
|
Liabilities |
||||
|
Non-Current Liabilities |
||||
|
Financial Liabilities |
||||
|
Other Financial Liabilities |
119 |
394 |
939 |
1,027 |
|
Provisions |
800 |
1,082 |
1,227 |
1,578 |
|
Noncurrent Tax Liabilities |
558 |
601 |
424 |
1,367 |
|
Deferred Tax Liabilities |
- |
- |
- |
5,988 |
|
Other Non-Current Liabilities |
197 |
- |
- |
- |
|
Total Non-Current Liabilities |
1,674 |
2,077 |
2,590 |
9,960 |
|
|
||||
|
Current Liabilities |
||||
|
Financial Liabilities |
||||
|
Borrowings |
- |
99 |
- |
- |
|
Trade Payables |
||||
|
Dues to Micro and Small Enterprises |
- |
- |
- |
67 |
|
Dues to Others |
7,170 |
7,206 |
7,535 |
8,735 |
|
Other Financial Liabilities |
214 |
492 |
932 |
1,206 |
|
Other Current Liabilities |
815 |
347 |
428 |
588 |
|
Provisions |
688 |
523 |
422 |
507 |
|
Total Current Liabilities |
8,887 |
8,667 |
9,317 |
11,103 |
|
|
||||
|
Total Equity and Liabilities |
17,862 |
18,629 |
20,153 |
68,757 |
Industry Overview
-
Fast-Moving Consumer Goods (FMCG) sector is India’s fourth-largest sector, with household and personal care accounting for 50% of FMCG sales in India.
-
Growing awareness, more accessible access, and changing lifestyles have been the key growth drivers for the sector.
-
The urban segment is the most significant contributor to the overall revenue generated by the FMCG sector in India. However, in the last few years, the FMCG market has grown faster in rural India compared to urban India.
-
Semi-urban and rural segments are multiplying, and FMCG products for 50% of the total spending.
-
The FMCG market in India is expected to increase at a CAGR of 14.9% to reach US $ 220 billion by 2025, from the US $ 110 billion in 2020.
-
The Government has allowed 100% FDI in food processing and single-brand retail and 51% in multi-brand retail. This would bolster employment, supply chain, and high visibility for FMCG brands across organized retail markets, strengthening consumer spending and encouraging product launches.
-
Rural Consumption has increased, led by a combination of increases in income levels. There is an increased demand for branded products in rural India.
-
On the other hand, with the share of the unorganized market in the FMCG sector falling, the organized sector growth is expected to rise with the increasing level of brand consciousness, augmented by the increase in modern retail.
Concall Overview (Q3FY2021)
-
FMCG market growth is moderating, and consumers are titrating volumes due to significant inflationary conditions.
-
The inflationary condition is likely to persist in the near term. The company expects to see sequentially more inflation in the March quarter than the December quarter.
-
Palm oil, Crude oil, derivatives, packaging, and freight continue to remain inflated. 30% of the business comes from ₹1, ₹5, and ₹10 packs, grammage reduction in these impacted the volume by 2%.
-
PLI approval in RTC/RTE and food processing categories results in 300 crores to 500 cores gain in over 5 years.
Hindustan Unilever Limited - Technical Analysis
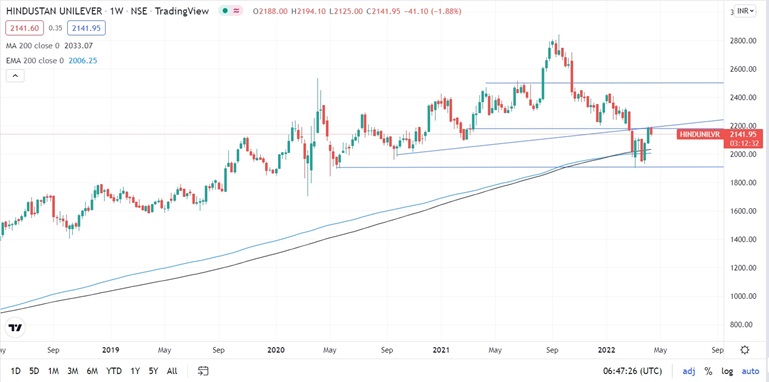
-
Stock is trading above EMA 200 and MA 200 indicators, with a strong support level of ₹1,916 and a resistance level at ₹2,500
-
One can accumulate this share at the current price.
Recommendation Rationale:
-
For the first nine months, Hindustan Unilever Limited’s revenue increased by 11.68% to ₹38,679 crores, compared to the previous year at ₹34,595. Profit After Tax increased by 13.36% to ₹6,865 crores compared to the last year at ₹5,809 crores.
-
The company has high solid operating efficiency because of its diversified product mix, robust distribution networks, and geographically diversified production facilities.
-
The company is virtually debt-free.
-
HUL has a strong financial risk profile and a leading position in the domestic FMCG industry.
-
The company has got eligible for the PLI scheme.
-
The strong branding, pricing power, cost-saving program, experienced management, and extensive distribution network will help the company maintain its market stake.
Valuation
-
The company’s revenue has increased at a CAGR of 7% from FY 2018-2021
-
The product mix revenue segment has helped the company maintain its revenue and net profit growth over the years.
-
The company’s ROE and ROCE are greater than 20%.
-
Q4FY2021 results could get impacted due to the increasing inflation, and its impact can be even seen in Q1FY2022-23.
-
Based on the current performance of the company in the first nine months, we expect the company could post higher revenue for the current financial (2022), corresponding to the previous year.
-
We have taken data for the last five years (2017-2021) and forecasted revenue for FY 2022-2026. Revenue growth is assumed to be 4.39%.
Estimated Income Statement (₹ in crores):
|
|
Mar-22 |
Mar-23 |
Mar-24 |
Mar-25 |
Mar-26 |
|
|
2022-E |
2023-E |
2024-E |
2025-E |
2026-E |
|
Revenue |
49,512.59 |
51,700.43 |
54,008.74 |
56,445.28 |
59,018.32 |
|
COGS |
23,563.99 |
24,608.76 |
25,711.22 |
26,875.07 |
28,104.29 |
|
Gross Profit |
25,948.60 |
27,091.67 |
28,297.53 |
29,570.21 |
30,914.03 |
|
Employee Expenses |
2,353.66 |
2,458.02 |
2,568.14 |
2,684.39 |
2,807.17 |
|
Other Expenses |
11,760.13 |
12,281.54 |
12,831.74 |
13,412.59 |
14,026.06 |
|
EBITDA |
11,834.81 |
12,352.11 |
12,897.65 |
13,473.24 |
14,080.80 |
|
Depreciation |
953.29 |
960.55 |
973.22 |
990.87 |
1,013.16 |
|
EBIT |
10,881.52 |
11,391.56 |
11,924.43 |
12,482.37 |
13,067.64 |
|
Financial Cost |
116.14 |
121.58 |
127.27 |
133.23 |
139.47 |
|
EBT |
10,765.38 |
11,269.97 |
11,797.16 |
12,349.14 |
12,928.16 |
|
Tax expenses |
2691.3449 |
2817.4937 |
2949.2901 |
3087.2854 |
3232.0411 |
|
PAT |
8,074.03 |
8,452.48 |
8,847.87 |
9,261.86 |
9,696.12 |
-
We initiate coverage on Hindustan Unilever Limited with a “BUY” and a 10 months Target Price of 2,561.
Disclaimer: This report is only for the information of our customers Recommendations, opinions, or suggestions are given with the understanding that readers acting on this information assume all risks involved. The information provided herein is not to be construed as an offer to buy or sell securities of any kind.
- Share :


Post a Comment
|
DISCLAIMER |
This report is only for the information of our customers. Recommendations, opinions, or suggestions are given with the understanding that readers acting on this information assume all risks involved. The information provided herein is not to be construed as an offer to buy or sell securities of any kind. ATS and/or its group companies do not as assume any responsibility or liability resulting from the use of such information.