Axis Bank Research Report

|
BUY |
Target |
Return |
|
1,200 |
1,393 |
16% |
Business landscape
Axis Bank operates in a dynamic financial services landscape, leveraging digital innovation, retail expansion, and ecosystem partnerships to drive sustainable growth. With India’s rising credit demand, financial inclusion push, and digital adoption, the bank is capitalizing on premium retail customers, SME lending, and tech-enabled banking journeys. Competing with peers like HDFC Bank and ICICI Bank, Axis focuses on CASA mobilization, customer experience, and product innovation. Its ‘One Axis’ strategy integrates banking, insurance, AMC, and broking arms to deliver end-to-end solutions, while investments in Gen AI, ESG finance, and rural outreach position it for long-term leadership and resilience.
|
Metric |
Value |
|
Market Cap (₹ Cr) |
3,71,273 |
|
52-Week Range (INR) |
1,340/934 |
|
No. of Shares |
3,08,65,70,375 |
|
1,200 |
|
|
BSE Code |
532215 |
|
NSE Code |
AXISBANK |
Shareholding pattern
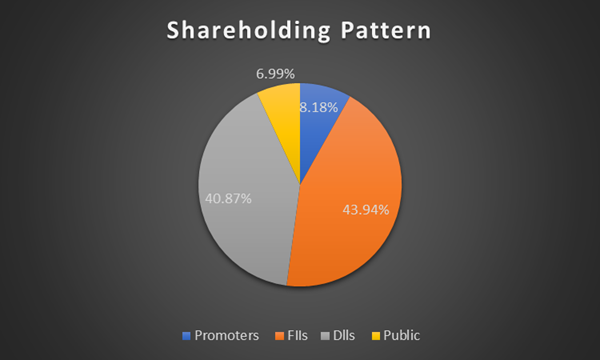
A Clear View of Stakeholder Distribution Across Shareholding Categories
Performance Compared to Nifty 50
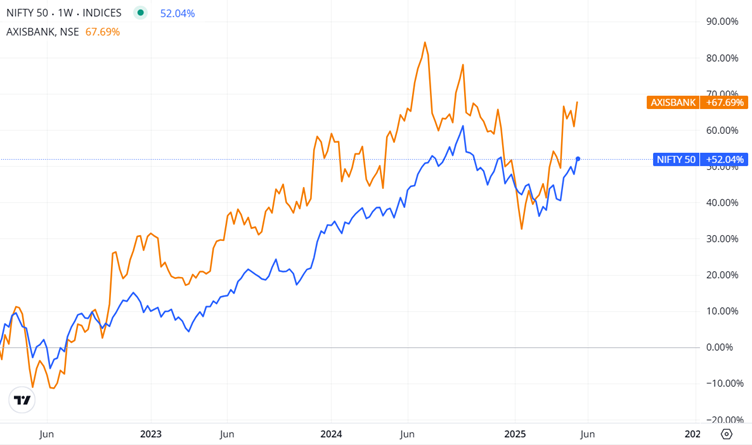
Axis Bank has outperformed the Nifty 50, delivering a 67.69% return compared to the index’s 52.04% over the same period. This strong relative performance reflects investor confidence driven by solid earnings, digital growth, and asset quality improvements.
Revenue
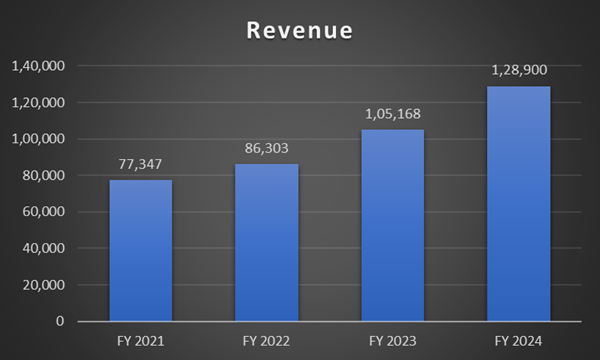
Axis Bank’s revenue has grown consistently from ₹77,347 Cr in FY21 to ₹1,28,900 Cr in FY24, marking a strong 66.7% increase over four years. This reflects the bank’s robust expansion across retail, digital, and corporate banking segments.
Net Profit
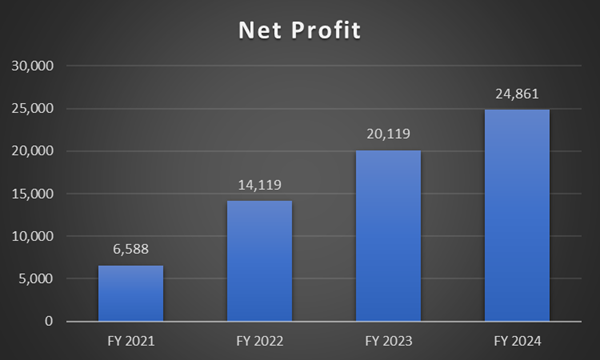
Axis Bank’s net profit surged from ₹6,588 Cr in FY21 to ₹24,861 Cr in FY24, showcasing a robust 3.8x growth in just four years. This reflects improved asset quality, strong credit growth, and sustained operating efficiency.
Growth Strategies
- Digital Banking Expansion : Scaling ‘open by Axis’ and ‘NEO’ platforms across retail and wholesale banking.
- Retail & Bharat Banking Focus : Strong push in rural and semi-urban (RuSu) markets via 2,480+ branches.
- One Axis Ecosystem : Integrated approach combining banking, broking, insurance, and AMC.
- Customer-Centric Innovation : Project SPARSH for service excellence; Siddhi app for employee enablement.
- ESG & Sustainability Leadership : ₹30,000 Cr in green/social finance disbursed (goal achieved ahead of time).
Risk Factors
- Deposit Growth Pressure: Lower CASA ratio (42%) and intense market competition for low-cost deposits.
- Regulatory & Compliance RisK : Evolving RBI guidelines around digital lending, data privacy, and asset quality norms.
- Credit Cycle Uncertainty : Rise in unsecured lending (PL, credit card) exposure may pose asset quality risks in downturn.
- Macroeconomic Volatility : Global interest rate shifts, currency fluctuations, and geopolitical risks impacting capital flow and bond yields.
- Tech & Cybersecurity Risk : Growing reliance on digital platforms requires constant upgrade in cyber resilience and AI governance.
Recent Updates
- Record Branch Expansion: Opened 475 branches, total crossing 5,000.
- Citi Consumer Business Integration: Completed successfully, boosting wealth and retail portfolio.
- Strong Profitability: FY24 PAT at ₹24,861 Cr, ROE of 19.29%, NIM at 4.07%.
- AI & Automation: Launched 'Adi' (Gen-AI chatbot), rolled out Copilot and Salesforce.
- Digital Lending Innovation: 5-minute KCC loans and MSME digital business loans launched.
- Subsidiary Growth: Axis Finance PAT up 28%, Axis AMC PAT ₹414 Cr, Max Life stake raised to 19.02%.
- Global ESG Recognition: MSCI ESG Rating upgraded to ‘A’; strong performance on Indian Corporate Governance Scorecard.
Peer Comparison
|
Metric |
Axis Bank |
ICICI Bank |
HDFC Bank |
Kotak Bank |
|
Revenue (₹ Cr) |
1,28,900 |
1,40,707 |
1,88,372 |
69,737 |
|
Net Profit (₹ Cr) |
24,861 |
42,409 |
64,062 |
14,578 |
|
Net Interest Margin (%) |
4.07% |
4.43% |
3.60% |
5.24% |
|
ROE (%) |
19.29% |
18.45% |
16.73% |
14.64% |
|
ROA (%) |
1.84% |
2.28% |
1.94% |
2.63% |
|
Gross NPA (%) |
1.43% |
2.16% |
1.24% |
1.39% |
|
Net NPA (%) |
0.31% |
0.42% |
0.33% |
0.34% |
|
CASA Ratio (%) |
42.00% |
43.60% |
38.20% |
45.40% |
|
Credit Growth (%) |
20% |
18% |
17% |
19% |
|
Deposits (₹ Cr) |
10,38,000 |
13,18,000 |
23,80,000 |
4,52,000 |
Profit & Loss Statement Forecast (Cr.)
|
Metric |
FY24 (Actual) |
FY25 (Forecast) |
FY26 (Forecast) |
FY27 (Forecast) |
FY28 (Forecast) |
|
Revenue |
1,28,900 |
1,43,200 |
1,59,500 |
1,77,400 |
1,97,100 |
|
Cost of Funds & Interest (COGS) |
56,700 |
63,500 |
71,000 |
79,600 |
89,200 |
|
Gross Profit |
72,200 |
79,700 |
88,500 |
97,800 |
1,07,900 |
|
Operating Expenses |
29,300 |
32,400 |
35,600 |
39,200 |
42,800 |
|
Operating Profit (EBIT) |
42,900 |
47,300 |
52,900 |
58,600 |
65,100 |
|
Depreciation |
3,900 |
4,300 |
4,700 |
5,100 |
5,500 |
|
Earnings Before Tax (EBT) |
39,000 |
43,000 |
48,200 |
53,500 |
59,600 |
|
Tax Expense (25%) |
9,750 |
10,750 |
12,050 |
13,375 |
14,900 |
|
Net Profit |
24,861 |
32,250 |
36,150 |
40,125 |
44,700 |
|
Net Profit Margin (%) |
19.30% |
22.50% |
22.70% |
22.60% |
22.70% |
Balance Sheet Forecast (Cr.)
|
Component |
FY24 (Actual) |
FY25 (Forecast) |
FY26 (Forecast) |
FY27 (Forecast) |
FY28 (Forecast) |
|
Equity Capital |
613 |
620 |
628 |
635 |
643 |
|
Reserves |
1,64,406 |
1,86,380 |
2,12,100 |
2,38,800 |
2,66,500 |
|
Deposits |
10,38,740 |
11,40,000 |
12,55,000 |
13,80,000 |
15,20,000 |
|
Borrowing |
1,67,280 |
1,78,000 |
1,89,500 |
2,01,700 |
2,14,600 |
|
Other Liabilities |
86,134 |
96,500 |
1,07,200 |
1,18,500 |
1,30,800 |
|
Total Liabilities |
14,57,173 |
16,01,500 |
17,91,928 |
19,74,635 |
21,98,543 |
|
Fixed Assets |
4,364 |
4,800 |
5,200 |
5,700 |
6,200 |
|
CWIP |
1,100 |
1,250 |
1,400 |
1,550 |
1,700 |
|
Investments |
3,33,633 |
3,68,000 |
4,02,000 |
4,40,000 |
4,80,000 |
|
Other Assets |
10,18,076 |
11,27,450 |
12,83,328 |
13,27,385 |
14,10,643 |
|
Total Assets |
14,57,173 |
16,01,500 |
17,91,928 |
19,74,635 |
21,98,543 |
Cash Flow Statement Forecast (Cr.)
|
Metric |
FY24 (Actual) |
FY25 (Forecast) |
FY26 (Forecast) |
FY27 (Forecast) |
FY28 (Forecast) |
|
Net Cash from Operating Activities |
28,500 |
31,400 |
35,200 |
39,600 |
44,200 |
|
Depreciation & Amortization |
3,900 |
4,300 |
4,800 |
5,300 |
5,900 |
|
Changes in Working Capital |
-4,000 |
-3,700 |
-3,400 |
-3,100 |
-2,800 |
|
Interest Paid |
-17,300 |
-18,900 |
-20,700 |
-22,800 |
-25,100 |
|
Taxes Paid |
-9,750 |
-10,650 |
-11,825 |
-13,075 |
-14,475 |
|
Net Cash from Investing Activities |
-11,500 |
-12,600 |
-13,800 |
-15,200 |
-16,700 |
|
Capital Expenditures |
-3,800 |
-4,100 |
-4,400 |
-4,700 |
-5,000 |
|
Proceeds from Sale of Assets |
1,200 |
1,350 |
1,500 |
1,650 |
1,800 |
|
Investments in Securities |
-8,900 |
-9,850 |
-10,900 |
-12,150 |
-13,500 |
|
Net Cash from Financing Activities |
4,200 |
5,000 |
5,900 |
6,800 |
7,700 |
|
Proceeds from Borrowings |
12,000 |
13,200 |
14,400 |
15,600 |
17,000 |
|
Repayment of Debt |
-7,500 |
-8,000 |
-8,500 |
-9,100 |
-9,800 |
|
Dividends Paid |
-300 |
-200 |
-100 |
-50 |
-50 |
|
Net Increase in Cash & Cash Equivalents |
21,200 |
23,800 |
27,300 |
31,200 |
35,200 |
|
Cash & Cash Equivalents at Year-End |
35,000 |
58,800 |
86,100 |
1,17,300 |
1,52,500 |
Technical Analysis
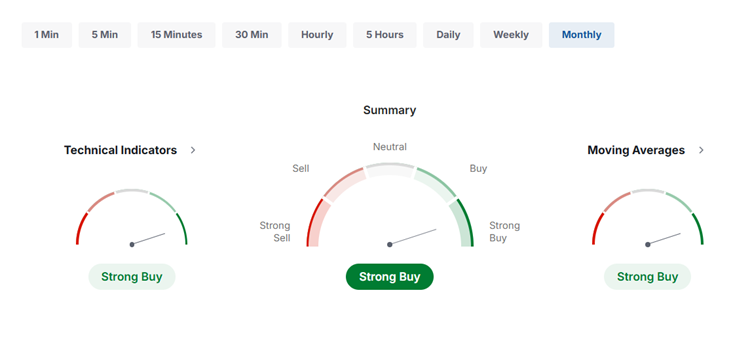
Summary : Strong Buy
|
Moving Averages: |
Strong Buy |
Buy: (12) |
Sell: (0) |
|
Technical Indicators: |
Strong Buy |
Buy: (9) |
Sell: (2) |
Technical Indicators
Summary: Strong buy Buy: 9 Neutral: 1 Sell: 1
|
Name |
Value |
Action |
|
RSI(14) |
60.517 |
Buy |
|
STOCH(9,6) |
42.775 |
Sell |
|
STOCHRSI(14) |
52.122 |
Neutral |
|
MACD(12,26) |
56.66 |
Buy |
|
ADX(14) |
33.248 |
Buy |
|
Williams %R |
-33.596 |
Buy |
|
CCI(14) |
65.1006 |
Buy |
|
ATR(14) |
129.5143 |
High Volatility |
|
Highs/Lows(14) |
1.7464 |
Buy |
|
Ultimate Oscillator |
53.953 |
Buy |
|
ROC |
14.897 |
Buy |
|
Bull/Bear Power(13) |
124.946 |
Buy |
Moving Averages
Summary: Strong Buy Buy: 12 Sell: 0
|
Name |
Simple |
Exponential |
||
|
MA5 |
1098.37 |
Buy |
1148.36 |
Buy |
|
MA10 |
1125.98 |
Buy |
1126.02 |
Buy |
|
MA20 |
1118.38 |
Buy |
1086.61 |
Buy |
|
MA50 |
929.96 |
Buy |
959.89 |
Buy |
|
MA100 |
760.77 |
Buy |
797.69 |
Buy |
|
MA200 |
534.76 |
Buy |
602.97 |
Buy |
Pivot Points
|
Name |
S3 |
S2 |
S1 |
Pivot Points |
R1 |
R2 |
R3 |
|
Classic |
858.99 |
945.67 |
1065.34 |
1152.02 |
1271.69 |
1358.37 |
1478.04 |
|
Fibonacci |
945.67 |
1024.5 |
1073.19 |
1152.02 |
1230.85 |
1279.54 |
1358.37 |
|
Camarilla |
1128.25 |
1147.17 |
1166.08 |
1152.02 |
1203.92 |
1222.83 |
1241.75 |
|
Woodie's |
875.47 |
953.91 |
1081.82 |
1160.26 |
1288.17 |
1366.61 |
1494.52 |
|
DeMark's |
- |
- |
1108.68 |
1173.69 |
1315.03 |
- |
- |
Valuation
Axis Bank Ltd. reported ₹1,28,900 Cr in revenue for FY24 with a net profit of ₹24,861 Cr, reflecting robust earnings growth and strong operational performance. The bank maintains a healthy ROE of 19.3%, an improving NIM of 4.07%, and best-in-class asset quality with a net NPA of just 0.31%, reinforcing its balance sheet strength. Trading at ~13.4x FY24 earnings and ~2.5x book value, Axis Bank remains attractively valued compared to peers. With its expanding retail and digital franchise, rising profitability, and strong capital adequacy, Axis Bank is a BUY recommendation. Investors may accumulate at current levels for long-term gains, with a target price of ₹1,250.
|
You may also be interested to know |
|
|
1. |
|
|
2. |
|
|
3. |
Hal: Powering India’S Defence Aviation – A Strategic Outlook |
|
4. |
Bajaj Finance Stock Analysis – Growth, Strategy And Forecast |
|
5. |
|
Check out our blog posts for expert insights, stock analysis, market trends, and the latest updates in the online stock market!
We're Live on WhatsApp! Join our channel for stock market insights & updates!
- Share :


Post a Comment
|
DISCLAIMER |
This report is only for the information of our customers. Recommendations, opinions, or suggestions are given with the understanding that readers acting on this information assume all risks involved. The information provided herein is not to be construed as an offer to buy or sell securities of any kind. ATS and/or its group companies do not as assume any responsibility or liability resulting from the use of such information.