ETERNAL RESEARCH REPORT
|
BUY |
Target |
Return |
|
244 |
300 |
23% |
Business landscape
Eternal-Zomato Limited operates in the digital consumer services sector, primarily focusing on food delivery, quick commerce, and dining-out experiences. As a leading tech platform in India, eternal connects millions of users with restaurants, delivery partners, and merchants through its ecosystem. With a growing demand for convenience, rising internet penetration, and changing consumer lifestyles, the company is capitalizing on emerging consumption trends. Its strategic investments in Blinkit for rapid commerce and Hyperpure for B2B restaurant supplies position eternal at the forefront of India's evolving on-demand economy, with significant growth potential both in urban markets and tier-II cities.
|
Metric |
Value |
|
Market Cap (₹ Cr) |
2,27,025 |
|
52-Week Range (INR) |
305 / 146 |
|
No. of Shares |
8,428,571,429 |
|
CMP (₹) |
244 |
|
BSE Code |
543320 |
|
NSE Code |
ETERNAL |
Shareholding pattern
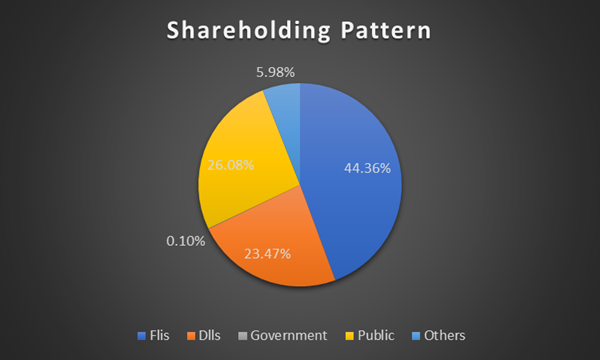
A Clear View of Stakeholder Distribution Across Shareholding Categories
Performance Compared to Nifty 50
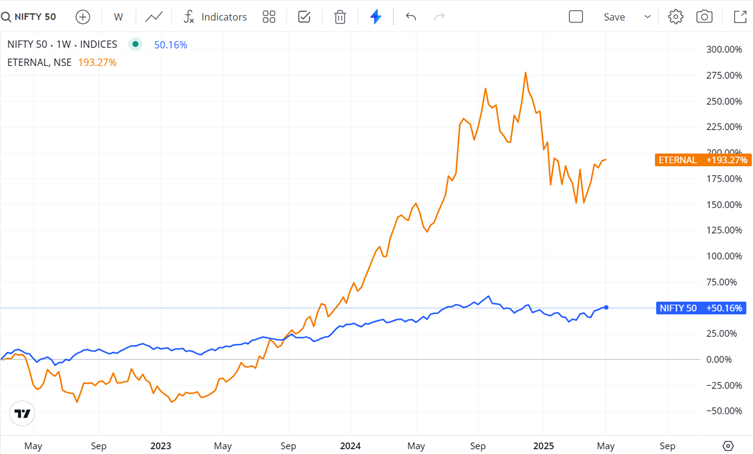
Eternal Ltd has delivered an impressive 193% return since 2022, significantly outperforming the Nifty 50 index, which gained 50% in the same period.
The stock's sharp rally reflects strong earnings momentum, segment expansion, and positive investor sentiment.
Revenue
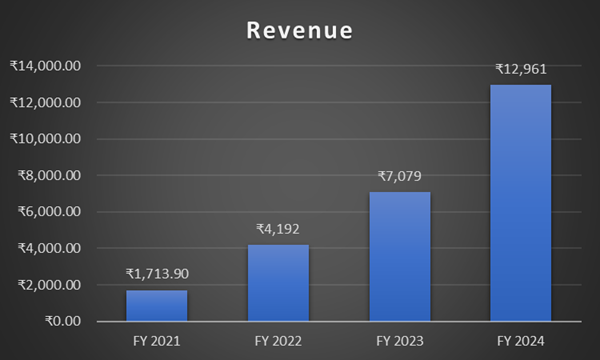
Eternal revenue has grown nearly 7.5x from ₹1,713 Cr in FY21 to ₹12,961 Cr in FY24, reflecting robust business expansion across segments. The consistent year-on-year growth highlights the company’s strong execution and increasing market share in food delivery and quick commerce.
Net Profit
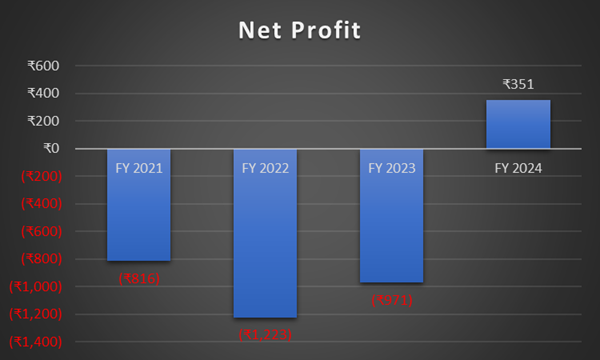
Eternal Ltd turned profitable in FY24 with a net profit of ₹351 Cr, marking a major turnaround from consistent losses in the past three years. This shift highlights improved operational efficiency, cost control, and scalability across its core business verticals.
Growth Strategies
- Market Penetration: Expanding reach to over 1,000 cities by FY25 to tap into underserved tier-II and tier-III markets.
- Diversification: Scaling Blinkit for <15-minute delivery and entering the ticketing/events space via acquisition of Paytm’s entertainment vertical.
- Profitability Focus: Achieved first full-year PAT in FY24; aims to improve margins via take-rate optimization and cost efficiencies.
- Tech Integration: Enhancing personalization and logistics efficiency using AI, data science, and real-time analytics.
- Brand Consolidation: Rebranded under parent company Eternal to unify food, commerce, and lifestyle services.
Risk Factors
- High Competition: Faces strong rivals like Swiggy and Zepto in both food delivery and quick commerce.
- Thin Margins: Blinkit’s expansion may impact short-term profitability due to high fixed and operational costs.
- Regulatory Scrutiny: Subject to antitrust probes for potential unfair practices with restaurant listings.
- Execution Risk: Rapid store expansion and new business integration may strain operational capacity.
- Consumer Behaviour: Changing preferences or economic slowdown can reduce discretionary spending.
Recent Updates
- Turned Profitable: Reported ₹351 Cr net profit in FY24, a first since inception.
- Blinkit Surge: Blinkit orders grew 71% YoY in FY24; plans to double store count to 1,000 by FY25.
- Acquisition: Acquired Paytm’s movie & events ticketing biz for $244.2 million to strengthen the “Going-out” segment.
- Service Exit: Discontinued low-demand offerings like Zomato Everyday and 10-minute delivery.
- Q4 FY25 Profit Drop: PAT declined 78% QoQ due to Blinkit-related investments and margin pressure.
Peer Comparison
|
Metric |
Eternal Ltd |
Swiggy |
Info Edge (India) |
One 97 Communications |
|
Market Cap (₹ Cr) |
2,27,025 |
77,085 |
91,454 |
52,669 |
|
Revenue (₹ Cr) |
12,961 |
7,016 |
2,536 |
7,660 |
|
Net Profit (₹ Cr) |
351 |
-2,350 |
725 |
-669 |
|
EBITDA Margin (%) |
3.20% |
-0.20% |
36.60% |
-3.30% |
|
Debt-to-Equity Ratio |
0.00x |
0.05x |
0.00x |
0.01x |
|
Return on Equity (%) |
3.18% |
- |
2.44% |
-8.50% |
Profit & Loss Statement Forecast (Cr.)
|
Metric |
FY24 (Actual) |
FY25 (Forecast) |
FY26 (Forecast) |
FY27 (Forecast) |
FY28 (Forecast) |
|
Revenue (Cr) |
12,961 |
16,500 |
20,000 |
24,000 |
28,500 |
|
Cost of Goods Sold (COGS) |
10,234 |
12,870 |
15,200 |
18,000 |
21,200 |
|
Gross Profit (Cr) |
2,727 |
3,630 |
4,800 |
6,000 |
7,300 |
|
Operating Expenses (Cr) |
2,685 |
2,970 |
3,600 |
4,200 |
4,800 |
|
Operating Profit (EBIT) |
42 |
660 |
1,200 |
1,800 |
2,500 |
|
Depreciation (Cr) |
250 |
300 |
350 |
400 |
450 |
|
Earnings Before Tax (EBT) |
410 |
960 |
1,300 |
1,800 |
2,400 |
|
Tax Expense (25%) (Cr) |
59 |
240 |
325 |
450 |
600 |
|
Net Profit (Cr) |
351 |
720 |
975 |
1,350 |
1,800 |
|
Net Profit Margin (%) |
2.7 |
4.4 |
4.9 |
5.6 |
6.3 |
Balance Sheet Forecast (Cr.)
|
Metric |
FY24 (Actual) |
FY25 (Forecast) |
FY26 (Forecast) |
FY27 (Forecast) |
FY28 (Forecast) |
|
Total Assets (Cr) |
20,421 |
21,800 |
23,395 |
25,250 |
27,275 |
|
Equity (Cr) |
16,621 |
17,405 |
18,535 |
19,925 |
21,485 |
|
Debt (Cr) |
0 |
0 |
0 |
0 |
0 |
|
Other Liabilities (Cr) |
3,800 |
4,395 |
4,860 |
5,325 |
5,790 |
|
Debt-to-Equity Ratio |
0 |
0 |
0 |
0 |
0 |
|
Return on Equity (%) |
2.11 |
4.13 |
5.26 |
6.77 |
8.38 |
|
Current Ratio |
4.41 |
4.45 |
4.5 |
4.55 |
4.6 |
|
Asset Turnover Ratio |
0.63 |
0.76 |
0.85 |
0.95 |
1.05 |
|
Equity Ratio |
0.81 |
0.8 |
0.79 |
0.79 |
0.79 |
Cash Flow Statement Forecast (Cr.)
|
Metric |
FY24 (Actual) |
FY25 (Forecast) |
FY26 (Forecast) |
FY27 (Forecast) |
FY28 (Forecast) |
|
Net Cash from Operating Activities (Cr) |
18500 |
27182 |
28428 |
29730 |
31093 |
|
Depreciation & Amortization (Cr) |
6200 |
6200 |
7005 |
7916 |
8945 |
|
Changes in Working Capital (Cr) |
-2000 |
-2000 |
-1800 |
-1620 |
-1458 |
|
Interest Paid (Cr) |
-4500 |
-4500 |
-4815 |
-5152 |
-5512 |
|
Taxes Paid (Cr) |
-5600 |
-6048 |
-6531 |
-7054 |
-7618 |
|
Net Cash from Investing Activities (Cr) |
-9500 |
-9500 |
-8433 |
-7404 |
-6407 |
|
Capital Expenditures (Cr) |
-6000 |
-6000 |
-5520 |
-5078 |
-4672 |
|
Proceeds from Sale of Assets (Cr) |
1800 |
1800 |
2016 |
2257 |
2528 |
|
Investments in Securities (Cr) |
-5300 |
-5300 |
-4929 |
-4583 |
-4263 |
|
Net Cash from Financing Activities (Cr) |
5500 |
5500 |
7110 |
8731 |
10378 |
|
Proceeds from Borrowings (Cr) |
12000 |
12000 |
12960 |
13996 |
15116 |
|
Repayment of Debt (Cr) |
-6000 |
-6000 |
-5400 |
-4860 |
-4374 |
|
Dividends Paid (Cr) |
-500 |
-500 |
-450 |
-405 |
-364 |
|
Net Increase in Cash & Cash Equivalents (Cr) |
14500 |
23182 |
27105 |
31057 |
35064 |
|
Cash & Cash Equivalents at Year-End (Cr) |
22000 |
45182 |
72287 |
103344 |
138407 |
Technical Analysis
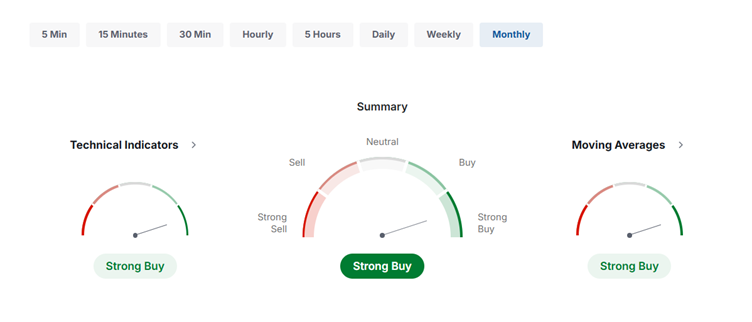
Summary : Strong Buy
|
Moving Averages: |
Strong Buy |
Buy: (11) |
Sell: (1) |
|
Technical Indicators: |
Strong Buy |
Buy: (6) |
Sell: (2) |
Technical Indicators
Summary: Strong Buy Buy: 6 Neutral: 2 Sell: 2
|
Name |
Value |
Action |
|
RSI(14) |
60.053 |
Buy |
|
STOCH(9,6) |
42.815 |
Sell |
|
STOCHRSI(14) |
21.214 |
Oversold |
|
MACD(12,26) |
33.41 |
Buy |
|
ADX(14) |
63.831 |
Buy |
|
Williams %R |
-42.803 |
Buy |
|
CCI(14) |
14.4054 |
Neutral |
|
ATR(14) |
44.28 |
High Volatility |
|
Highs/Lows(14) |
48.044 |
Neutral |
|
Ultimate Oscillator |
30.093 |
sell |
|
ROC |
23.996 |
Buy |
|
Bull/Bear Power(13) |
60.053 |
Buy |
Moving Averages
Summary: Strong Buy Buy: 11 Sell: 1
|
Name |
Simple |
Exponential |
||
|
MA5 |
222.71 |
Buy |
233.54 |
Buy |
|
MA10 |
243.70 |
Sell |
226.13 |
Buy |
|
MA20 |
203.69 |
Buy |
200.90 |
Buy |
|
MA50 |
127.08 |
Buy |
160.91 |
Buy |
|
MA100 |
63.54 |
Buy |
143.65 |
Buy |
|
MA200 |
31.77 |
Buy |
136.86 |
Buy |
Pivot Points
|
Name |
S3 |
S2 |
S1 |
Pivot Points |
R1 |
R2 |
R3 |
|
Classic |
155.08 |
174.94 |
203.73 |
223.59 |
252.38 |
272.24 |
301.03 |
|
Fibonacci |
174.94 |
193.52 |
205.01 |
223.59 |
242.17 |
253.66 |
272.24 |
|
Camarilla |
219.14 |
223.6 |
228.06 |
223.59 |
236.98 |
241.44 |
245.9 |
|
Woodie's |
159.54 |
177.17 |
208.19 |
225.82 |
256.84 |
274.47 |
305.49 |
|
DeMark's |
- |
- |
213.66 |
228.56 |
262.31 |
- |
- |
Valuation
Eternal Ltd. (Zomato Group) posted a consolidated revenue of ₹12,961 Cr in FY24 and achieved a net profit of ₹351 Cr, marking its first full-year profitability since inception. The company holds a robust balance sheet with zero debt and cash reserves exceeding ₹12,000 Cr. Growth continues across segments—food delivery, quick commerce (Blinkit), and B2B supplies (Hyperpure)—supported by operational efficiencies and increasing user engagement. Technical indicators reflect positive sentiment, with sustained momentum above key moving averages. With expanding scale, a strong customer base, and improving margins, Eternal remains a buy for long-term investors with a target price of ₹300.
|
You may also be interested to know |
|
|
1. |
|
|
2. |
|
|
3. |
|
|
4. |
|
|
5. |
|
Check out our blog posts for expert insights, stock analysis, market trends, and the latest updates in the online stock market!
We're Live on WhatsApp! Join our channel for stock market insights & updates!
- Share :


Post a Comment
|
DISCLAIMER |
This report is only for the information of our customers. Recommendations, opinions, or suggestions are given with the understanding that readers acting on this information assume all risks involved. The information provided herein is not to be construed as an offer to buy or sell securities of any kind. ATS and/or its group companies do not as assume any responsibility or liability resulting from the use of such information.