YES Bank Limited Research Report
|
Industry |
Market Price |
Recommendation |
Target |
Time Horizon |
|
Bank |
13.25 |
Buy |
17 |
1 Year |
Q4 FY 2022 Review
Yes Bank Limited reported a total net income of ₹5872 crores for the quarter ended March 31, 2022, compared to ₹4834 crores for March 31, 2021. Profit After Tax was ₹371 crores for the quarter ended, March 31, 2022, compared to -3790 crores, during the corresponding quarter of the previous year, respectively.
Yes Bank Limited - Investment Summary
|
CMP (₹) |
13.25 |
|
52 Week H/L |
16.25/10.50 |
|
Market Cap (crores) |
33197 |
|
Face Value (₹) |
2.00 |
|
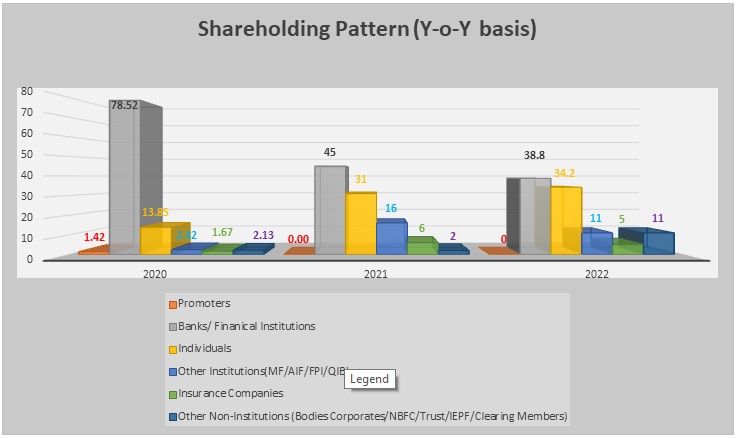
Promoter Holding (%) |
0 |
|
Non-Promoter Holding (%) |
100 |
|
Total (%) |
100 |
|
Book Value |
13.23 |
|
EPS TTM |
.42 |
Overview
-
Yes Bank is a 'Full-Service Commercial 'Bank' providing a complete range of products, services, and technology- driven digital offerings, catering to Retail, MSME & Corporate clients.
-
Yes Bank operates its Investment banking, Merchant banking & Brokerage businesses through YES SECURITIES, a wholly-owned subsidiary of the Bank. Headquartered in Mumbai, it has a Pan-India presence, including an IBU at GIFT City and a Representative Office in Abu Dhabi.
-
Yes Bank Opened 50 new branches taking the total branch count to 1122 for FY22 and increase of 2,000+ YES Bankers taking the total headcount of employees to 24,346 in FY22
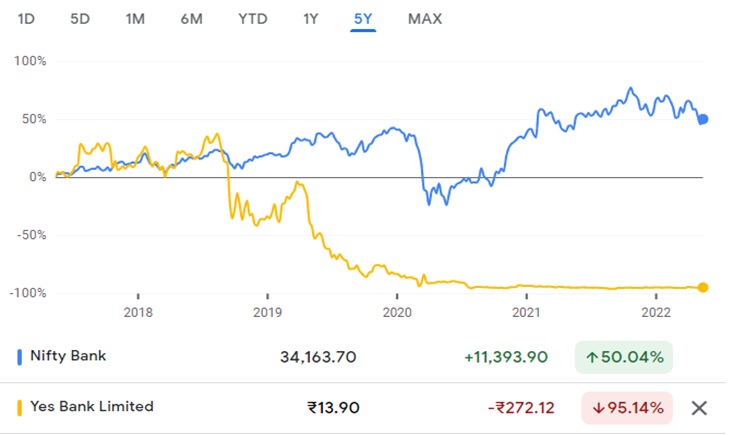
Beta: .92 |
Alpha: -32.46 |
Risk Reward Ratio:1:2 |
Margin of Safety: 17.94% |
Yes Bank Limited - Quarterly Summary
|
Quarterly (₹ in crores) |
Mar-22 |
Dec-21 |
Sep-21 |
June-21 |
|
Interest Income |
4946 |
4898 |
4651 |
4524 |
|
Interest Expended |
3130 |
3134 |
3140 |
3122 |
|
Net Interest Income |
1816 |
1764 |
1511 |
1402 |
|
|
|
|
|
|
|
Other Income |
925 |
733 |
811 |
1086 |
|
Total Income |
2741 |
2497 |
2322 |
2488 |
|
|
|
|
|
|
|
Payments to and Provisions for Employee |
797 |
732 |
733 |
670 |
|
Other Expenses |
1166 |
1034 |
916 |
902 |
|
Provision and Contingencies |
271 |
374 |
376 |
644 |
|
EBT |
507 |
357 |
297 |
272 |
|
|
|
|
|
|
|
Tax Expenses |
135 |
89 |
75 |
69 |
|
PAT |
372 |
266 |
222 |
203 |
Business
-
Incorporated in 2004, Yes Bank was founded by Rana Kapoor and Ashok Kapur. It was India's fourth-largest private lender bank in 2020. However, due to mismanagement by the founders, bad loans, and severe deterioration in its financial statement, Yes bank almost collapsed.
-
However, on 5 March 2020, in an attempt to avoid the Bank's collapse, RBI took control of it. RBI imposed a 30-day moratorium on Yes Bank's Operations in the interest of its customers and depositors. It suspended and superseded Yes Bank's board and later reconstructed the board, making Prashant Kumar (Former CFO, SBI) its new MD & CEO, along with Sunil Mehta, former non-executive chairman of Punjab National Bank, as Yes Bank's non-executive chairman.
-
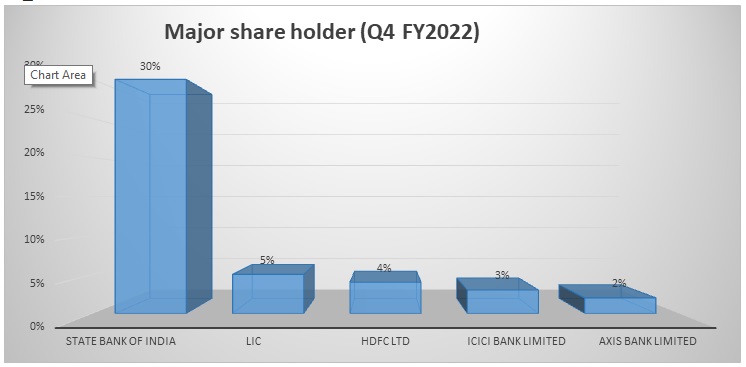
Presently, the State Bank of India is the largest shareholder in the Bank, with a stake of 30.00% as of 31st March 2022.
-
Yes Bank became the country’s 6th largest private sector bank in terms of total assets during the year.
-
Yes Bank is a go-to bank for digital transactions, with nearly every third digital transaction taking place through Yes Bank, enabling it to be a banker of majority e-commerce and fintech companies.
-
Yes bank continues its leading market share position in UPI, Aadhaar renewal services, IMPS, NEFT, and micro-ATM with the number one position in UPI and NEFT. UPI transactions Yes Bank has a 42% market share. On the Aadhaar enabled payment services, Yes Bank’s share is 18.2%. On the NEFT services, Yes Bank is ranked number one, and its market share is 14.3%. Hence, if one takes the average of the entire digital payment space, including UPI, Aadhaar enabled, NEFT, IMPS, and RTGS, then Yes Bank contributes one-third of digital transactions supported by the Yes Bank infrastructure.
-
Yes bank is a scheduled commercial bank regulated by the Reserve Bank of India.
-
Yes Bank has three subsidiaries – YES Securities (India) Limited, YES Trustee Limited and YES Asset Management (India) Limited.
-
Yes Bank provides UPI services for several major companies, such as Airtel, Cleartrip, RedBus, and PhonePe.
-
Yes bank acquired over 24 percent of stake in dish TV India on 30 May 2020.
-
Yes Bank has equities listed on the Bombay Stock Exchange and the National Stock Exchange of India and has bonds listed on the London stock exchange.
-
Yes Bank’s business segments are Retail, Micro-SME, SME, Mid-corporate, Corporate, Treasury, and Other banking operations.
-
Yes Bank's business segments include:
-
Treasury Operations:
-
Treasury activity Includes investments, all financial market activities undertaken on behalf of the Group’s customers, proprietary trading, maintenance of reserve requirements, and resource mobilization from other banks and financial institutions.
-
Treasury actively manages liquidity and compliance with critical regulatory items such as CRR (cash reserve ratio)/ SLR (statutory liquidity ratio) and trading in fixed income securities and currencies.
-
Treasury also shares the responsibility of interest rate risk management of the Bank.
-
-
Corporate Banking:
-
It Includes lending, deposit-taking, and other services offered to corporate customers. The Bank intends to have limited exposure in Corporate Banking and increases exposure to retail banking and SMEs.
-
The Bank has a robust underwriting and credit/process to address the inherent risks in Corporate Banking.
-
-
Retail Banking:
-
Retail Banking: Includes lending, deposit-taking, and other services offered to retail customers.
-
-
Other Banking Operations:
-
Includes para banking activities like third-party product distribution, merchant banking, etc.
-
-
-
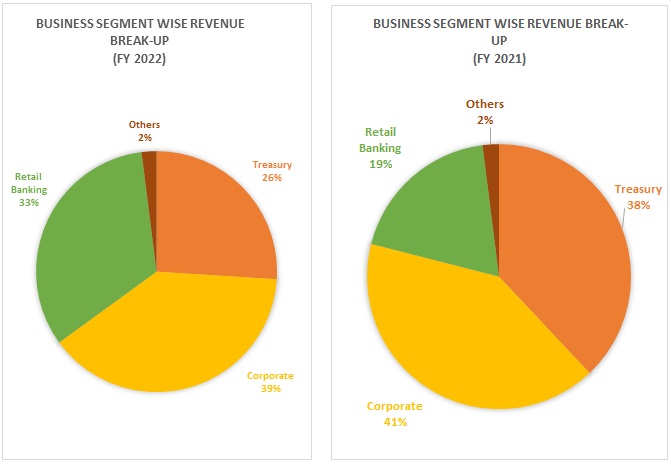
Out of the total revenue, 26% has been generated from Treasury operations, 39% from Corporate Banking, 33% from Retail Banking, and 2% from others in FY 2022, compared to 38%, 41%, 19%, and 2% in FY 2021, respectively.
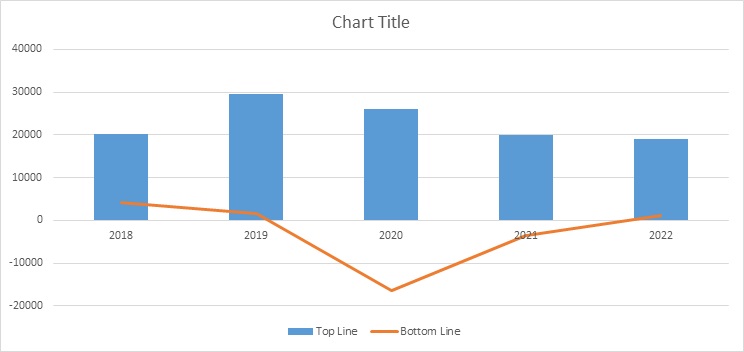
Yes Bank Limited - Revenue Trend
Topline and Bottom-line trends (in crores)
Ratio Analysis
|
Particulars |
Mar-18 |
Mar-19 |
Mar-20 |
Mar-21 |
Mar-22 |
|
Net Interest Margin |
3.5% |
3.2% |
2.2% |
2.8% |
2.3% |
|
Gross NPA |
1.3% |
3.2% |
16.8% |
15.4% |
13.9% |
|
Net NPA |
1.0% |
1.9% |
5.0% |
5.9% |
4.5% |
|
Provision Coverage Ratio |
50.0% |
43.1% |
73.8% |
78.6% |
81.5% |
|
Capital Adequacy Ratio |
18.4% |
16.5% |
8.5% |
17.5% |
17.4% |
|
CASA Ratio |
36.5% |
33.1% |
26.6% |
26.1% |
31.1% |
|
ROE |
17.7% |
6.5% |
-81.8% |
-11.4% |
3.2% |
|
ROA |
1.6% |
0.5% |
-5.1% |
-1.3% |
.4% |
|
Cost to income ratio |
40.2% |
43.5% |
65.7% |
53.8% |
70.1% |
Yes Bank Limited - Financial Overview
|
Particulars |
Mar-18 |
Mar-19 |
Mar-20 |
Mar-21 |
Mar-22 |
|
Net Interest Margin |
3.5% |
3.2% |
2.2% |
2.8% |
2.3% |
|
Gross NPA |
1.3% |
3.2% |
16.8% |
15.4% |
13.9% |
|
Net NPA |
1.0% |
1.9% |
5.0% |
5.9% |
4.5% |
|
Provision Coverage Ratio |
50.0% |
43.1% |
73.8% |
78.6% |
81.5% |
|
Capital Adequacy Ratio |
18.4% |
16.5% |
8.5% |
17.5% |
17.4% |
|
CASA Ratio |
36.5% |
33.1% |
26.6% |
26.1% |
31.1% |
|
ROE |
17.7% |
6.5% |
-81.8% |
-11.4% |
3.2% |
|
ROA |
1.6% |
0.5% |
-5.1% |
-1.3% |
.4% |
|
Cost to income ratio |
40.2% |
43.5% |
65.7% |
53.8% |
70.1% |
Yes Bank Limited - Profit and Loss Statement (₹ in crores except EPS)
|
Particulars |
Mar-18 |
Mar-19 |
Mar-20 |
Mar-21 |
Mar-22 |
|
Interest income |
20,269 |
29,624 |
26,052 |
20,039 |
19,019 |
|
Interest Expended |
12,529 |
19,811 |
19,258 |
12,611 |
12,528 |
|
Net Income |
7,739 |
9,813 |
6,794 |
7,428 |
6,490 |
|
|
|||||
|
Other income |
5,293 |
4,675 |
11,956 |
3,436 |
3,405 |
|
Total income |
13,032 |
14,488 |
18,750 |
10,864 |
9,895 |
|
|
|||||
|
Operating expenses |
5,274 |
6,361 |
6,870 |
5,917 |
6,981 |
|
Provision and Contingencies |
1,554 |
5,778 |
32,718 |
9,709 |
1,480 |
|
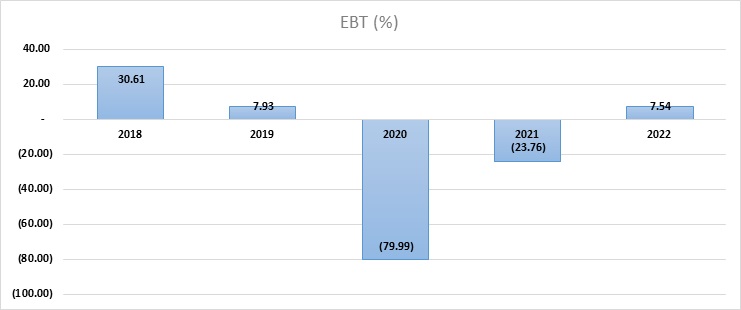
EBT |
6,205 |
2,349 |
-20,838 |
-4,762 |
1,434 |
|
|
|||||
|
Tax expenses |
1,971 |
640 |
-4,406 |
-1,273 |
370 |
|
PAT |
4,233 |
1,709 |
-16,433 |
-3,489 |
1,064 |
|
|
|||||
|
EPS |
|||||
|
Basic |
18.46 |
7.4 |
-56.11 |
-1.64 |
0.43 |
|
Diluted |
18.09 |
7.33 |
-56.11 |
-1.64 |
0.43 |
|
|
|||||
|
Adjusted Number of shares |
|||||
|
Basic |
229 |
230 |
292 |
2127 |
2475 |
|
Diluted |
234 |
233 |
292 |
2127 |
2475 |
Yes Bank Limited - Cash Flow Statement (₹ in crores)
|
Particulars |
Mar-18 |
Mar-19 |
Mar-20 |
Mar-21 |
Mar-22 |
|
Net Profit Before tax for the year |
6,205 |
2,349 |
-20,838 |
-4,762 |
1,434 |
|
Net Cash Flow from/(used in) Operating activities |
-21,810 |
-24,573 |
-57,721 |
50,124 |
23,598 |
|
Net Cash flow used in Investing Activities |
-8,745 |
-6,294 |
14,192 |
5,664 |
-399 |
|
Net Cash Flow from Financing Activities |
35,748 |
33,039 |
25,038 |
-34,942 |
8,391 |
|
Net changes in Cash and Cash Equivalents |
5,199 |
2,231 |
-18,555 |
20,895 |
31,536 |
|
Cash and Cash Equivalents (beginning of the year) |
19,555 |
24,754 |
26,985 |
8,430 |
29,325 |
|
Cash And Cash Equivalents (end of the year) |
24,754 |
26,985 |
8,430 |
29,325 |
60,861 |
Yes Bank Limited - Balance Sheet (₹ in crores)
|
Particulars |
Mar-18 |
Mar-19 |
Mar-20 |
Mar-21 |
Mar-22 |
|
CAPITAL & LIABILITIES: |
|
|
|
|
|
|
Capital |
460.59 |
463.01 |
2,510.09 |
5,010.98 |
5,010.99 |
|
Reserves and Surplus |
25,291.91 |
26,424.40 |
19,184.87 |
28,127.31 |
28,687.98 |
|
Total Capital and Reserves |
25,752.51 |
26,887.41 |
21,694.96 |
33,138.29 |
33,698.97 |
|
|
|||||
|
Deposits |
2,00,688.60 |
2,27,557.90 |
1,05,311.17 |
1,62,845.93 |
1,97,062.58 |
|
Borrowings |
74,893.58 |
1,08,424.11 |
1,13,790.50 |
63,949.08 |
72,340.18 |
|
Other Liabilities and Provisions |
11,114.96 |
17,990.19 |
17,035.53 |
13,660.13 |
15,476.01 |
|
Total Liabilities |
2,86,697.15 |
3,53,972.20 |
2,36,137.20 |
2,40,455.15 |
2,84,878.77 |
|
|
|||||
|
Total Capital & Liabilities |
3,12,449.65 |
3,80,859.61 |
2,57,832.16 |
2,73,593.44 |
3,18,577.74 |
|
|
|||||
|
ASSETS: |
|||||
|
Cash and Balances with Reserve Bank of India |
11,425.75 |
10,797.74 |
5,943.66 |
6,812.79 |
9,067.27 |
|
Balances with Banks and Money at call and short Notice |
13,328.07 |
16,187.19 |
2,486.70 |
22,512.46 |
37,680.94 |
|
Investments |
68,293.44 |
89,328.53 |
43,747.80 |
43,114.65 |
51,753.99 |
|
Advances |
2,03,518.83 |
2,41,397.19 |
1,71,433.09 |
1,66,804.86 |
1,80,959.01 |
|
Fixed Assets |
837.30 |
829.89 |
1,023.38 |
2,158.38 |
2,141.01 |
|
Other Assets |
15,046.28 |
22,319.07 |
33,197.53 |
32,190.30 |
36,975.53 |
|
Total Assets |
3,12,449.65 |
3,80,859.61 |
2,57,832.16 |
2,73,593.44 |
3,18,577.75 |
Industry Overview
-
The Indian Banking System comprises 12 public sectors, 22 private sector banks, 46 foreign banks, 56 regional banks, 1484 urban co-operative banks, and 96,000 rural co-operative banks.
-
RBI has set up a PCR, an extensive database of credit information accessible to all stakeholders. Further IBC (Amendment) Bill has been passed, strengthening the banking industry.
-
India Ratings and Research (Ind-Ra) has revised its outlook on the banking sector to ‘improving’ from ‘stable’ for FY 2023. The Agency expects credit growth to pick up to 10% and a GNPA ratio of 6.1%.
-
The digital payment systems in India have evolved among 25 countries, with India’s Immediate Payment Services (IMPS) being the only system at level five in the faster payments Innovation Index (FPII).
-
Debit cards are gradually replacing credit cards as the preferred payment mode in India after demonetization.
-
In January 2022, UPI recorded 4.62 billion transactions worth Rs. 8.32 Trillion.
-
The number of transactions through Immediate Payment Service (IMPS) reached 430.67 million and amounted to ₹3.70 million.
-
As of February 21, 2022, the number of bank accounts opened under the government’s Flagships financial inclusion drive ‘Pradhan Mantri Jan Dhan’ (PMJDY)- reached 44.63 crores, and deposits in the Jan Dhan Bank accounts totaled l.58 trillion.
-
Nowadays, the concept of Buy Now Pay Later [BNPL] has revolutionized the banking ecosystem in India. Banks have understood the importance of effectively leveraging this concept to improve customer experience and build positive sentiment. It is now considered the new form of consumer lending – where banks are extending the necessary credit in interest-free or spaced-out interest-bearing installments to its consumers. The market size of BNPL is a staggering $3-3.5 billion (about Rs 22,500-Rs 26,250 crores) and is expected to grow to $45-50 billion (about Rs 3.37-Rs 3.75 lakh crore) by 2026, according to a consultancy firm RedSeer.
-
In May 2022, the RBI increased the repo rate by 40 bps up to 4.40% from 4% earlier. The last repo rate cut was in May 2020. The hike will come into effect immediately. Further, the Cash Reserve Ratio (CRR) has been hiked by 50 bps, exerting further upward pressure on interest rates. It appears that borrowers should prepare for higher borrowing rates, and depositors, especially those dependent on FDs, should be thrilled as it is anticipated that interest rates offered on deposits will be hiked.
Concall Overview (Q4 FY2022)
-
Yes Bank became the 6th largest private sector bank.
-
The Bank returned to profits after FY 2019 as it reported a total profit of 1066 crores in FY 2022. And Rs.367 Crores in Q4. The increase in profit is 38% up quarter-on-quarter. The operating profits stand at Rs.2916 Crores for the entire year and Rs.770 Crores in Q4 and again this is 6% up quarter on quarter.
-
On the advances side of Yes Bank, the mix between the retail, MSME, and corporate has improved by 400 basis points, and currently, this is 60:40, 60% on the retail, MSME, and 40% on the corporate. Yes Bank has also sanctioned and disbursed Rs.70000 Crores of loans across wholesale, SME, retail, and rural segments during the financial year. Yes Bank’s three segments, retail, SME, and medium enterprises, have shown a strong advances growth of 31%, 16%, and 32%
-
On the deposit side, its deposits have doubled to two lakh Crores in the last two years. The CASA ratio is currently at 31.1%
-
Yes Bank NIM (net interest margin) expanded by about 40 basis points this year. It started at about 2.1% in June and ended at about 2.5% for Q4.
-
C/D (credit to deposit) ratio continues to improve, at 91.8% v/s. 102.4% in FY21 and 95.6% last quarter.
-
11.4 Lacs CASA Accounts opened in FY22 vs. 6.6 Lacs in FY21.
-
Total Provision Costs for FY22 at INR 1,480 Crores declined 84% Y-o-Y, aided by lower slippages and higher recoveries & upgrades; Q4FY22 Provision costs at INR 271 Crores declined 28% Q-o-Q.
-
The GNPA and NNPA have been reducing quarter on quarter in FY 22. As well as per the Concall bank is transferring all the stressed assets to ARC by June 2023 (Asset Reconstruction Company).
Segment wise non-performing assets (INR in crores)
|
Particulars |
Q1FY2022 |
Q2FY2022 |
Q3FY2022 |
Q4FY2022 |
|
Retail |
168.2 |
157.9 |
127.9 |
109.3 |
|
SME |
81.4 |
80.7 |
76.7 |
73.9 |
|
Medium Enterprise |
45 |
39.3 |
39.7 |
40.1 |
|
Corporates |
2556.1 |
2596.1 |
2621.2 |
2574.3 |
|
Gross NPA |
2850.6 |
2874.1 |
2865.4 |
2797.5 |
|
Net NPA |
945.4 |
958.6 |
932.3 |
820.4 |
The Rise & Fall of Yes Bank:
-
From its inception, Yes Bank had a very high growth rate. In its initial years, Yes Bank witnessed a triple-digit y-o-y growth rate, and in the period 2009 to 2018, it still maintained an average growth rate of 30%+, with the highest of 58% in 2011 and the lowest of 16% in 2015.
How did it manage to post such a phenomenal performance, and was there anything fishy?
-
(Too) Aggressive Lending: After 2008, Deposits grew much more rapidly than Advances. In 2010, the deposits grew y-o-y by 66%, while advances grew by 79%. Consequently, it put a lot of pressure on the Bank's liquidity position.
-
Loans to companies under Financial Stress: Yes Bank granted mammoth loans to companies facing financial instability and could convert into NPA shortly.
A list of some companies are:
Anil Ambani Group, Essel Group, DHFL, IL&FS, Jet Airways, GC Power, Cox & Kings, Altico, Cafe Coffee Day, Essar Power, Vardaraj Cement, Radius Developers, Mantri Group etc.
-
In 2016, RBI took an asset quality review of Yes Bank and discovered a divergence of 4176 crores of NPAs, a very high figure. In the following year, an even higher deviation of 6355 crores made stakeholders question the integrity of Yes Bank.
Recommendation Rationale:
Positives
-
For FY2023, as per guidance given by Yes Bank CASA ratio is expected to be at 35%. The majority of stressed assets in the Bank arose due to corporate lending. Recovery from retail lending and MSME are more manageable than corporates as the loan's ticket size is small. Earlier, nearly the mix between the retail, MSME, and corporate was 35:65; this is 35% on the retail, MSME, and 65% on the corporate. Presently, on the advances side of Yes Bank, the mix between the retail, MSME, and corporate has improved, and currently, this is 60:40, 60% on the retail, MSME, and 40% on the corporate.
Yes Bank targets a total advances growth of more than 15%, contributed by 10% growth in large corporates and more than 25% growth in retail MSME and medium enterprises.
-
Yes Bank is expected to sustain a CD (Credit to deposit) ratio of less than 100% for the third year consecutively.
-
Yes Bank would target recovery and upgrades of more than Rs.5000 Crores this year, which would help return on assets (ROA) touch 1% by the end of FY2023.
-
In addition to Crisil and Moody, the CARE has upgraded the Bank to triple BBB plus from BBB and maintains a positive outlook.
-
Yes Bank's Revenue and PAT are improving Q-o-Q basis.
-
The slippage continues to trend lower. This is Rs.5795 Crores for FY2022 against Rs.12000 Crores in FY2021 and for the Q4 it is Rs.802 Crores and sequentially has come down from Rs.978 Crores in Q3. Slippages for the second half of this year are lower than the first half. Consequently, the provisioning cost that would have come out of it is deferred, as the extent of provisioning cost that will come out of the new slippages is expected to be lower next year.
-
Yes Bank will expect an expansion in the Fees to assets and at the core level, which would mean PPOP (pre-provision operating profit) to the asset will also expand 40 to 50 basis points through fiscal FY2023, enhancing return on assets.
-
Yes Bank's net interest margin expanded by about 40 basis points this year. It started at about 2.1% in June & have ended at about 2.5% in Q4. Although repo rates have increased and are further expected to increase, banks also will increase the borrowing rates and pass on the effect to consumers. Additionally, in FY2023, the amount of net interest margin expansion should be higher next year as per the Bank.
-
Economic recovery, experience management, branch expansion plans, and improvement in deposits and loan books shall help the Bank's overall growth in terms of business and finance.
-
As per the Concall, Yes Bank has plans to transfer its stress assets to Asset Reconstruction Company, because of which GNPA and NPA of Bank will almost reduce and will result in clean-up of the balance the sheet.
Threats (Why share price is tanking y-o-y and not moving up)
-
SBI is the largest shareholder in Yes Bank with a 30% stake, down from 48% in March 2020. There is a lock-in period of three years for SBI, which means it cannot lower its holding below 26% till March 2023.
So, will SBI continue to retain holding after March 2023?
While other investors and existing shareholders will have a lock-in period of three years for 75 percent of their investment in YES Bank. So, next year if SBI and existing shareholders sell their shares, there might be a surplus of sellers of shares of yes Bank, which might affect its market price.
-
When inflation is on the rise, to tackle inflation, RBI raises the repo rate, which will affect Bank's deposit rate and borrowing rates. In such situations, large-cap banks are more flexible, nimbler, and better placed in their ability to transmit frequent rate movements through deposit rates. Earlier, when the repo rate was increased by RBI Feb '18 and Apr '19, large-cap banks increased deposit rates by 74bps on average, while mid/small-cap banks increased their rates by 111bps on average for a similar maturity period of retail term deposits.
-
The Bank has very high GNPA and NNPA, which is very alarming. Although it has been on the decline for a year still, even this year, it was at 13.93%, which is very risky. Also, as inflation rises, retailers might face difficulty repaying the loans, further accelerating the GNPA.
-
Yes Bank had issued new shares by way of FPO raising Rs. 15000 crore in 2020 to boost its capital levels according to regulatory norms. Presently, Yes Banks CET 1 is at 11.6 %, which is sub-par among peers and thus would call for frequent dilution at lower valuations and may issue another round of Follow-on Public Offer in coming years to boost its capital. This may affect the share price of existing shareholders as the overall EPS of the Bank may deteriorate due to a rise in the number of shares and no corresponding increase in earnings.
-
The number of shares outstanding of Yes Bank in 2018, when its share price skyrocketed to 385, was 230 crores shares & in 2022, it is 2505.5 crores shares.
The number of shares has increased almost 10.9 times with no corresponding increase in profits.
In 2018, when the stock touched 385, its market capitalization was approximately 88500 crores. And today, its market capitalization is 14 * 2505 crore shares is about 35000 crore.
If we multiply the present market capitalization of 35000 crores by 2.53 times, we get to its old market capitalization of 90000 crores. So current share price is 14Rs multiplied by 2.57 times, and we get a share price of 35.34Rs. And Market capitalization is derived by (Market price per share * the total number of shares outstanding). So at 35.34Rs, market capitalization is 35.34Rs * 2505 shares = 88500 crore approximately.
So, if Yes Bank shares hit 35.34Rs now, it is as good as it has touched 385Rs earlier.
-
With nearly one-third of the total digital transactions supported by Yes infrastructure with the help of tie-ups with Amazon pay for UPI transactions and several fintech companies like FidyPay, The Fintech Meetup, NPCI, etc., most of the digital transactions offered by Yes Bank are not translating to profits. And Yes Bank currently has the intention to acquire market share and later start converting revenues into profitability.
-
But with the competition in the digital market & nature of consumers who generally want the best products and services at the best price. It will be an ardent task for Yes Bank to start reaping the benefits of the hard work in the digital space by translating services into profits.
Valuation:
-
The bank's Net Interest Income has increased at a CAGR from 2017-to 2022 at 2.75 %. However, the growth rate was impacted by the restructuring of Yes bank and the Covid pandemic, which withered the world in the last 2.5 years. Management is targeting a growth of 15%, but we are considering a rational expectation of 12% growth in revenue.
-
Other income is assumed to increase every year by 3%.
-
Provision was very high in the year 2020 and 2021 and these years have been ignored in the calculation as it was exceptional.
Estimated Income Statement (₹ in crores):
|
Particulars |
Mar-23 |
Mar-24 |
Mar-25 |
Mar-26 |
Mar-27 |
|
Interest income |
21301 |
23431 |
25774 |
28352 |
31187 |
|
Interest Expended |
14119 |
15531 |
17084 |
18793 |
20672 |
|
Net Income |
7182 |
7900 |
8690 |
9559 |
10515 |
|
|
|||||
|
Other income |
3507 |
3612 |
3720 |
3832 |
3947 |
|
Total income |
10689 |
11512 |
12411 |
13391 |
14462 |
|
|
|||||
|
Operating expenses |
6177 |
6561 |
6701 |
7371 |
7797 |
|
Provision and Contingencies |
2486 |
2735 |
3008 |
3309 |
3640 |
|
EBT |
2025 |
2217 |
2701 |
2711 |
3026 |
|
|
|||||
|
Tax expenses |
506 |
554 |
675 |
678 |
756 |
|
PAT |
1519 |
1663 |
2026 |
2033 |
2269 |
|
|
|||||
|
EPS |
|||||
|
Basic |
0.61 |
0.67 |
0.82 |
0.82 |
0.92 |
|
Diluted |
0.61 |
0.67 |
0.82 |
0.82 |
0.92 |
|
|
|||||
|
Adjusted Number of shares |
|
|
|
|
|
|
Basic |
2475 |
2475 |
2475 |
2475 |
2475 |
|
Diluted |
2475 |
2475 |
2475 |
2475 |
2475 |
-
Price to earnings ratio to forecast the price has been taken as the average of the current Yes Bank P/E and current Industry P/E which is 27.5 (33+22/2)
-
Target price = FY 23 EPS * Average P/E = .614*27.5= Rs. 17 (provided there is no further fresh issue of shares to public)
-
We initiate coverage on Yes Bank Limited with a “BUY” and a 1-year Target Price of ₹ 17.
Disclaimer: This report is only for the information of our customer Recommendations, opinions, or suggestions are given with the understanding that readers acting on this information assume all risks involved. The information provided herein is not to be construed as an offer to buy or sell securities of any kind.
- Share :


Post a Comment
|
DISCLAIMER |
This report is only for the information of our customers. Recommendations, opinions, or suggestions are given with the understanding that readers acting on this information assume all risks involved. The information provided herein is not to be construed as an offer to buy or sell securities of any kind. ATS and/or its group companies do not as assume any responsibility or liability resulting from the use of such information.